Thought Leader – Dwiref Shah
Artificial Intelligence is rapidly transforming software development, but most organizations still spend weeks building internal dashboards, governance tools, and monitoring applications.
At Snowflake, the introduction of Cortex Code is changing that reality.
In one of our recent internal experiments at Stridely Solutions, we used Snowflake Cortex Code inside Snowsight to automatically generate a complete Streamlit-based Account Usage & Governance Application — without manually writing application code.
No frontend coding. No backend APIs. No manual SQL integration. No custom framework setup.
The entire application-including UI, queries, charts, governance pages, and monitoring dashboards — was generated directly through Cortex Code prompts.
This is not just a productivity improvement. It represents a major shift in how modern data engineering teams can build operational tooling inside Snowflake.
What is Snowflake Cortex Code?
Snowflake introduced Cortex Code as an AI-powered development assistant integrated directly into Snowsight.
It enables developers and data engineers to:
- Generate SQL automatically
- Build Streamlit applications
- Create data visualizations
- Generate Python code
- Build governance dashboards
- Accelerate troubleshooting
- Automate repetitive engineering tasks
Instead of manually building applications page by page, engineers can describe requirements in natural language, and Cortex Code generates the implementation automatically.
The Use Case: Internal Snowflake Monitoring & Governance App
Most organizations struggle with operational visibility inside Snowflake environments.
Teams typically need separate tools for:
- Usage monitoring
- Cost analysis
- Query performance tracking
- User activity auditing
- Access management
- Role-based governance
- Security reviews
Building such systems manually usually requires:
- Frontend developers
- Backend APIs
- SQL developers
- DevOps setup
- Authentication integration
- Visualization frameworks
Using Cortex Code, we wanted to test a simple question:
Can an entire operational monitoring platform be generated directly inside Snowflake using AI? The answer was surprisingly impressive.
The Result
Using only prompts in Cortex Code, we generated a complete multi-page Streamlit application containing:
1. Account Usage Dashboard
Example Cortex Code Prompt
Build a Streamlit dashboard using Snowflake ACCOUNT_USAGE views.
Requirements:
– Show current month credit usage
– Show last month usage
– Display month-over-month comparison
– Show total credits consumed
– Show estimated cost amount
– Add monthly trend graph
– Create warehouse usage visualizations
– Build responsive Streamlit layout
Example Auto-Generated Query
SELECT
DATE_TRUNC(‘MONTH’, START_TIME) AS USAGE_MONTH,
SUM(CREDITS_USED) AS TOTAL_CREDITS,
ROUND(SUM(CREDITS_USED) * 3,2) AS ESTIMATED_AMOUNT
FROM SNOWFLAKE.ACCOUNT_USAGE.WAREHOUSE_METERING_HISTORY
GROUP BY 1
ORDER BY 1 DESC;
Example Streamlit Component Generated by Cortex Code
import streamlit as st
import pandas as pd
st.title(‘Snowflake Account Usage Dashboard’)
st.metric(‘Current Month Credits’, current_month)
st.metric(‘Last Month Credits’, last_month)
st.line_chart(df_usage)
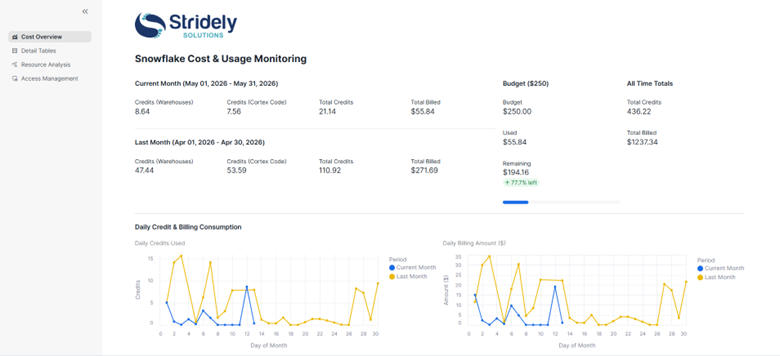
A complete executive monitoring dashboard was generated automatically.
Features Included
- Current month usage
- Previous month usage
- Month-over-month comparison
- Total credits consumed
- Total warehouse usage
- Estimated cost/amount
- Monthly trend analysis
- Usage graphs and visualizations
- Consumption summaries
The generated dashboard provided instant visibility into Snowflake consumption patterns.
Business Value
This dashboard helps organizations:
- Monitor cloud spend
- Track warehouse usage
- Detect unexpected credit spikes
- Understand consumption patterns
- Improve budgeting accuracy
2. Query Performance & Usage Analysis Page
Example Cortex Code Prompt
Create a Streamlit monitoring page for Snowflake query performance.
Requirements:
– Show top 5 expensive queries
– Show top 5 users by warehouse consumption
– Display query execution history
– Highlight long-running queries
– Add warehouse utilization charts
Example Auto-Generated Query
SELECT
USER_NAME,
QUERY_TEXT,
TOTAL_ELAPSED_TIME/1000 AS EXECUTION_SECONDS,
CREDITS_USED_CLOUD_SERVICES
FROM SNOWFLAKE.ACCOUNT_USAGE.QUERY_HISTORY
ORDER BY EXECUTION_SECONDS DESC
LIMIT 5;
Example Generated Streamlit Visualization
st.subheader(‘Top Expensive Queries’)
st.dataframe(query_df)
st.subheader(‘Top Users by Consumption’)
st.bar_chart(user_df)
The second page focused on operational monitoring and query analysis.
Cortex Code Automatically Generated
- Top 5 users by usage
- Top 5 expensive queries
- Query execution analysis
- Long-running query insights
- Query history details
- Credit-heavy workloads
- Warehouse utilization visibility
This became extremely useful for:
- Performance tuning
- Cost optimization
- Identifying inefficient workloads
- Monitoring developer activities
- Capacity planning
Operational Benefits
Engineering teams can quickly identify:
- Expensive workloads
- Poorly optimized queries
- Heavy warehouse consumers
- Bottlenecks in processing
- Resource-intensive users
Without manually building monitoring systems.
3. Permissions & Access Governance Page
Example Cortex Code Prompt
Build a governance dashboard using Snowflake metadata.
Requirements:
– Show total users
– Show total roles
– Show database access details
– Map users to assigned roles
– Display role hierarchy
– Create access control visualizations
Example Auto-Generated Query
SELECT
ROLE AS ROLE_NAME,
GRANTEE_NAME AS USER_NAME
FROM SNOWFLAKE.ACCOUNT_USAGE.GRANTS_TO_USERS
ORDER BY ROLE_NAME;
Example Generated Governance Visualization
st.subheader(‘User Role Mapping’)
st.dataframe(role_df)
st.subheader(‘Access Control Summary’)
st.metric(‘Total Roles’, total_roles)
st.metric(‘Total Users’, total_users)
The third page focused on governance and security monitoring.
Automatically Generated Governance Features
- Total databases
- Roles overview
- Users overview
- Access control visibility
- Role hierarchy insights
- User-role mapping
- Role-object access visibility
- Governance reporting
The application provided a centralized governance view directly inside Snowflake.
This significantly improved visibility into access management processes.
Security Benefits
The governance page helps organizations:
- Improve audit readiness
- Track user access
- Validate role assignments
- Monitor security exposure
- Simplify compliance reviews
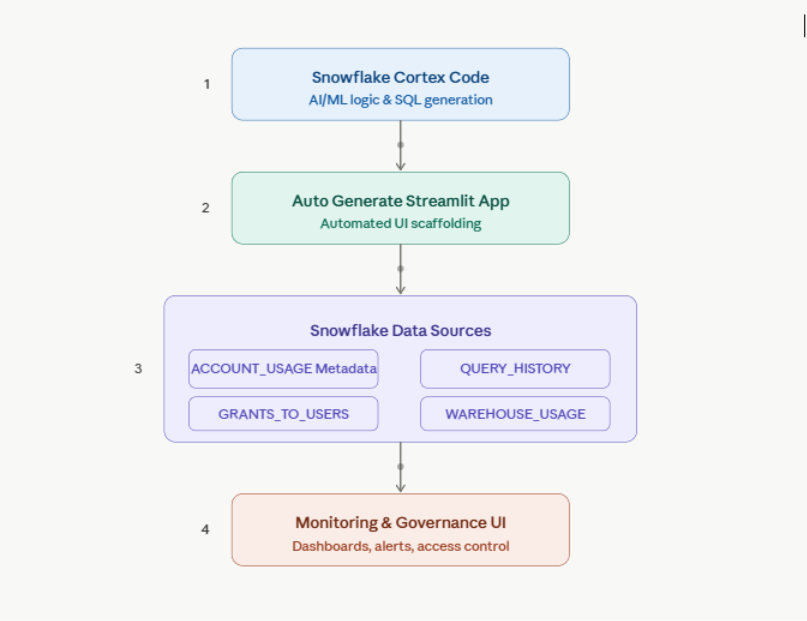
Architecture Overview
Snowflake Cortex Architecture
The Most Impressive Part: No Manual Coding
The biggest takeaway from this experiment was not just the application quality.
It was the development experience.
Traditionally, building such a solution would involve:
| Traditional Development | Cortex Code Approach |
| Frontend development | Auto-generated |
| SQL query writing | Auto-generated |
| Python scripting | Auto-generated |
| Streamlit layout coding | Auto-generated |
| Visualization coding | Auto-generated |
| Dashboard wiring | Auto-generated |
| Iterative UI adjustments | Prompt-driven |
| Manual optimization | AI-assisted |
The development cycle reduced dramatically.
What previously required days or weeks could now be prototyped in hours.
Real Business Benefits
1. Faster Operational Visibility
Teams can instantly monitor:
- Credit usage
- Warehouse consumption
- User activity
- Query performance
- Governance status
without building separate enterprise tools.
2. Reduced Development Effort
Data engineers can focus on:
- Optimization
- Architecture
- Governance
- Business logic
instead of spending time building dashboards manually.
3. Improved Cost Governance
Organizations gain immediate visibility into:
- Expensive workloads
- High-consuming users
- Warehouse inefficiencies
- Unoptimized queries
This directly helps reduce Snowflake operational costs.
4. Better Security & Access Monitoring
The governance page enables teams to quickly review:
- User access
- Role assignments
- Database permissions
- Security exposure areas
This improves audit readiness and governance transparency.
Why This Matters for the Future of Data Engineering
AI-assisted development inside data platforms is becoming a major industry shift.
With tools like Cortex Code:
- Data engineers become application builders
- Governance tools become easier to create
- Monitoring systems can be generated rapidly
- Internal operational tooling becomes democratized
Instead of waiting for centralized engineering teams, platform teams can now generate customized operational applications directly inside Snowflake.
This dramatically accelerates innovation.
Key Observations from Our Experience
During implementation, we observed several major advantages:
Rapid Prototyping
Ideas moved from concept to working application extremely quickly.
Simplified Streamlit Development
Even complex layouts and analytical pages were generated automatically.
Easier SQL Generation
Cortex Code generated optimized account usage queries with minimal effort.
Improved Developer Productivity
Teams spent more time validating business logic instead of writing repetitive code.
Where Cortex Code Can Add Value Beyond This Use Case
Based on our experience, Cortex Code has strong potential for:
- FinOps dashboards
- Data quality monitoring
- ETL pipeline observability
- Governance portals
- Data lineage visualization
- Incident monitoring
- Metadata exploration
- Self-service analytics tools
- Audit dashboards
- Cost optimization frameworks
Final Thoughts
Our experiment demonstrated that Snowflake Cortex Code is far more than a coding assistant.
It can fundamentally change how internal data applications are designed and delivered.
By automatically generating a fully functional Streamlit monitoring and governance application, Cortex Code showcased how AI can significantly reduce engineering effort while improving operational visibility.
For organizations investing heavily in Snowflake, this opens exciting opportunities around:
- Faster platform operations
- AI-driven development
- Governance automation
- Cost transparency
- Operational efficiency
Stridely has hands-on experience with Snowflake projects where data quality, access rules, and compliance expectations are high. Our teams help build tagging strategies, implement masking, and row access rules, and bring visibility across systems. Contact us today.